<?xml version="1.0" encoding="utf-8"?><feed xmlns="http://www.w3.org/2005/Atom" xml:lang="en"><generator uri="https://jekyllrb.com/" version="3.10.0">Jekyll</generator><link href="https://prateek-arora.github.io/feed/by_tag/postgresql.xml" rel="self" type="application/atom+xml" /><link href="https://prateek-arora.github.io/" rel="alternate" type="text/html" hreflang="en" /><updated>2026-10-06T19:14:14+05:30</updated><id>https://prateek-arora.github.io/feed/by_tag/postgresql.xml</id><title type="html">Prateek Arora</title><subtitle>Notes on distributed systems, databases, frontend, and AI by Prateek Arora, a full-stack engineer with five years in fintech and SaaS.</subtitle><author><name>Prateek Arora</name></author><entry><title type="html">I timed 179 index recommendations on real data. 18% made the query slower.</title><link href="https://prateek-arora.github.io/2026/10/timed-179-index-recommendations/" rel="alternate" type="text/html" title="I timed 179 index recommendations on real data. 18% made the query slower." /><published>2026-10-06T00:00:00+05:30</published><updated>2026-10-06T00:00:00+05:30</updated><id>https://prateek-arora.github.io/2026/10/timed-179-index-recommendations</id><content type="html" xml:base="https://prateek-arora.github.io/2026/10/timed-179-index-recommendations/"><![CDATA[<p>My tool tells you things like “this index cuts the query’s cost by 91%”. Before releasing it, I
wanted to know what that number is actually worth.</p>

<p>The tool is <a href="https://github.com/Prateek-Arora/pglens">PgLens</a>, a Postgres index advisor I’m
building. Like several other advisors, it checks each suggestion with <a href="https://github.com/HypoPG/hypopg">HypoPG</a>:
create a hypothetical index, run <code class="language-plaintext highlighter-rouge">EXPLAIN</code> again, and keep the suggestion if the planner’s estimated
cost drops by at least 15%.</p>

<p>That’s an estimate, not a timing. So I built every index for real and timed the queries.</p>

<h2 id="the-setup">The setup</h2>

<ul>
  <li>The <a href="https://github.com/gregrahn/join-order-benchmark">Join Order Benchmark</a>: 113 queries over the
real IMDB data, 7 GB loaded. It was made to catch the planner getting row counts wrong, so it’s a
hard test.</li>
  <li>PostgreSQL 16, hypopg 1.4.</li>
  <li>PgLens made 214 planner-validated recommendations for those queries. They name only 10 distinct
indexes, because one foreign-key index helps many queries.</li>
  <li>I wrote down the metrics and what counts as a win before the first run: 15% faster is a win,
5% slower is a loss.</li>
</ul>

<h2 id="what-happened">What happened</h2>

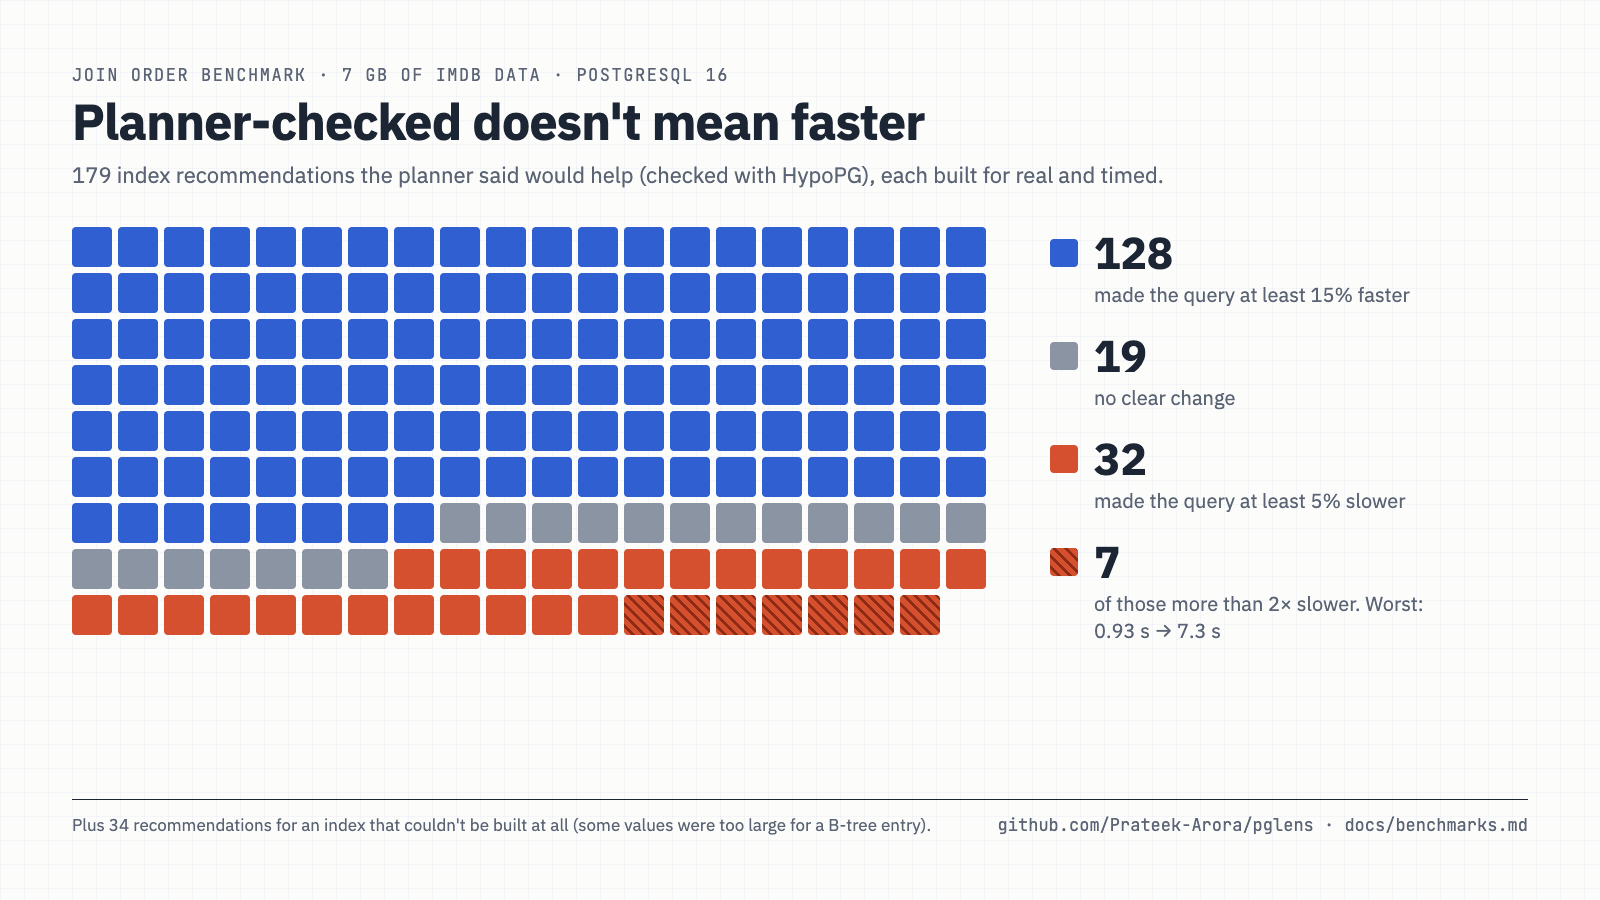
<p><img src="/assets/img/job-benchmark.png" alt="179 measured recommendations: 128 faster, 19 no clear change, 32 slower" /></p>

<ul>
  <li><strong>128 of 179</strong> made their query at least 15% faster.</li>
  <li><strong>32 of 179</strong> made it at least 5% slower. <strong>7</strong> made it more than twice as slow.</li>
  <li><strong>34</strong> couldn’t be measured, because the index can’t be built.</li>
</ul>

<p>The worst one was query 10c with an index on <code class="language-plaintext highlighter-rouge">cast_info (movie_id)</code>. Estimated: 91% cheaper.
Measured: <strong>0.93 s before, 7.3 s after</strong>. I ran it again by hand to be sure: about 1 s became
about 9 s.</p>

<p>With the index there, the planner picked a nested loop that probes <code class="language-plaintext highlighter-rouge">cast_info</code> once per row of a
join. It underestimated how many rows that join returns, so the loop ran far more often than it
planned for: the query read 71 times as many buffers. HypoPG can’t catch this, because it asks the
same planner with the same wrong row counts. Every advisor built on hypothetical indexes
has this blind spot, mine included.</p>

<p>The 34 are one index, PgLens’s #2 suggestion, <code class="language-plaintext highlighter-rouge">movie_info (info)</code>:</p>

<div class="language-plaintext highlighter-rouge"><div class="highlight"><pre class="highlight"><code>ERROR:  index row requires 9392 bytes, maximum size is 8191
</code></pre></div></div>

<p>1,182 of 14.8 million values are too long for a B-tree entry. A hypothetical index never writes an
entry, so it can’t know.</p>

<h2 id="what-the-planner-got-right">What the planner got right</h2>

<p>The ranking. PgLens’s #1 index saved <strong>364 s of the 424 s</strong> its queries took, and the order of the
indexes by estimated saving was close to the order by measured saving (Spearman 0.83). Per query,
the estimated percentage told me almost nothing.</p>

<p>So “which index matters most?” is a fair question for the planner. “How much faster will this
query get?” isn’t.</p>

<h2 id="what-i-changed">What I changed</h2>

<ul>
  <li>Every planner number in PgLens is labelled as an estimate, and never shown as a speedup.</li>
  <li><code class="language-plaintext highlighter-rouge">pglens confirm</code> builds the index on a copy of your database and times your own queries with and
without it. On the same data it flagged 10c as about ten times slower.</li>
  <li>Once you build an index, PgLens shows each query’s measured time before and after.</li>
  <li>It now warns when an index’s column may hold values too long for a B-tree.</li>
</ul>

<h2 id="try-it">Try it</h2>

<p>PgLens is open source (Apache-2.0), self-hosted, and only ever reads from your database. It ranks
your queries by the time they actually took, suggests a planner-checked index for each, lets you
time it on a copy first, and shows the measured before and after once you build it. Four <code class="language-plaintext highlighter-rouge">make</code>
commands from the README start a demo with a slow workload in about three minutes:
<a href="https://github.com/Prateek-Arora/pglens">github.com/Prateek-Arora/pglens</a>. It’s a release
candidate, so bug reports are very welcome.</p>

<p>The method, the tables and the scripts are in
<a href="https://github.com/Prateek-Arora/pglens/blob/main/docs/benchmarks.md">docs/benchmarks.md</a>, and
<code class="language-plaintext highlighter-rouge">make accuracy-job</code> reruns the whole thing. If you run <code class="language-plaintext highlighter-rouge">pglens confirm</code> on a copy of your own
database, I’d like to see the numbers, especially the ones that make my tool look bad.</p>

<p>I built PgLens with Claude Code as a pair. The benchmark design, the rules written down before the
run, and every raw number are in the repo, so you don’t have to take my word for any of it.</p>]]></content><author><name>Prateek Arora</name></author><category term="postgresql" /><summary type="html"><![CDATA[Planner-validated index advice, built for real and timed on the Join Order Benchmark.]]></summary><media:thumbnail xmlns:media="http://search.yahoo.com/mrss/" url="https://prateek-arora.github.io/assets/og/timed-179-index-recommendations.png" /><media:content medium="image" url="https://prateek-arora.github.io/assets/og/timed-179-index-recommendations.png" xmlns:media="http://search.yahoo.com/mrss/" /></entry><entry><title type="html">A read-only safety belt that breaks your app’s writes</title><link href="https://prateek-arora.github.io/2026/09/read-only-safety-belt/" rel="alternate" type="text/html" title="A read-only safety belt that breaks your app’s writes" /><published>2026-09-29T00:00:00+05:30</published><updated>2026-09-29T00:00:00+05:30</updated><id>https://prateek-arora.github.io/2026/09/read-only-safety-belt</id><content type="html" xml:base="https://prateek-arora.github.io/2026/09/read-only-safety-belt/"><![CDATA[<p>The setting I added so my tool could never write to your database turned out to break your app’s
writes instead.</p>

<p>The tool is <a href="https://github.com/Prateek-Arora/pglens">PgLens</a>, a Postgres index advisor I’m
building. It only needs to read, so it logs in as a role with no write grants, and it used to start
every connection with:</p>

<div class="language-sql highlighter-rouge"><div class="highlight"><pre class="highlight"><code><span class="k">SET</span> <span class="k">SESSION</span> <span class="k">CHARACTERISTICS</span> <span class="k">AS</span> <span class="n">TRANSACTION</span> <span class="k">READ</span> <span class="k">ONLY</span><span class="p">;</span>
</code></pre></div></div>

<p>Before the first release I wanted to see what happens if someone points it at a connection pooler,
like Supabase’s port 6543 or a Neon <code class="language-plaintext highlighter-rouge">-pooler</code> host. 
So I tried it with PgBouncer in transaction mode. 
PgLens connected, then the application connected and tried to write:</p>

<div class="language-plaintext highlighter-rouge"><div class="highlight"><pre class="highlight"><code>CREATE TABLE orders_archive (id int);
ERROR:  cannot execute CREATE TABLE in a read-only transaction
</code></pre></div></div>

<p>The app did nothing wrong. It just got the connection PgLens had used a moment earlier.
Not great for a tool whose whole pitch is that it’s safe to point at production.</p>

<figure>
<video controls="" muted="" playsinline="" preload="none" poster="/assets/video/pgbouncer-read-only-leak.jpg" src="/assets/video/pgbouncer-read-only-leak.mp4"></video>
<figcaption>The leak and the fix, on PgBouncer in transaction mode with a pool of one server connection.</figcaption>
</figure>

<h2 id="why">Why</h2>

<p>A transaction pooler hands the same server connection to the next client.
Session settings stay on that connection, so my <code class="language-plaintext highlighter-rouge">SET</code> went with it.</p>

<p>PgBouncer’s docs do say session <code class="language-plaintext highlighter-rouge">SET</code> doesn’t work in transaction mode.
I read that as: your setting might not stick.
It sticks, just for the wrong client.</p>

<h2 id="the-fix">The fix</h2>

<p>Don’t set anything on the session. Pass the guards as startup options instead, which last only as
long as that backend:</p>

<div class="language-plaintext highlighter-rouge"><div class="highlight"><pre class="highlight"><code>options=-c default_transaction_read_only=on -c statement_timeout=30s -c lock_timeout=5s
</code></pre></div></div>

<p>PgBouncer refuses them (<code class="language-plaintext highlighter-rouge">unsupported startup parameter in options</code>), which is what I want:
PgLens stops and tells you to connect directly.</p>

<p>Since poolers can be configured to ignore that,
PgLens also checks on connect that the backend pid stays the same and read-only is on.
An integration test runs it against a real PgBouncer.</p>

<h2 id="if-you-build-tools-that-connect-to-other-peoples-databases">If you build tools that connect to other people’s databases</h2>

<ul>
  <li>Don’t <code class="language-plaintext highlighter-rouge">SET</code> anything on a connection unless you know it goes straight to Postgres.</li>
  <li>Put guards in startup options, and check they took effect.</li>
  <li>Test against a transaction-mode pooler. Some of your users are behind one.</li>
</ul>

<p>The alternatives I rejected are in
<a href="https://github.com/Prateek-Arora/pglens/blob/main/docs/decisions.md#adr-0053">ADR-0053</a>.</p>

<p><strong>Update, 1 Oct:</strong> PgBouncer 1.26.0, out on 23 September, now tracks <code class="language-plaintext highlighter-rouge">default_transaction_read_only</code>
on Postgres 14 and later, so this exact leak is fixed there. Settings it doesn’t track, like
<code class="language-plaintext highlighter-rouge">statement_timeout</code>, still leak. It also tells the client its pool mode at login, so a tool can
allow session mode and refuse only transaction mode.</p>]]></content><author><name>Prateek Arora</name></author><category term="postgresql" /><summary type="html"><![CDATA[Through PgBouncer in transaction mode, a monitoring tool's read-only setting lands on the next client's connection.]]></summary><media:thumbnail xmlns:media="http://search.yahoo.com/mrss/" url="https://prateek-arora.github.io/assets/og/read-only-safety-belt.png" /><media:content medium="image" url="https://prateek-arora.github.io/assets/og/read-only-safety-belt.png" xmlns:media="http://search.yahoo.com/mrss/" /></entry></feed>