I timed 179 index recommendations on real data. 18% made the query slower.
Planner-validated index advice, built for real and timed on the Join Order Benchmark.
My tool tells you things like “this index cuts the query’s cost by 91%”. Before releasing it, I wanted to know what that number is actually worth.
The tool is PgLens, a Postgres index advisor I’m
building. Like several other advisors, it checks each suggestion with HypoPG:
create a hypothetical index, run EXPLAIN again, and keep the suggestion if the planner’s estimated
cost drops by at least 15%.
That’s an estimate, not a timing. So I built every index for real and timed the queries.
The setup
- The Join Order Benchmark: 113 queries over the real IMDB data, 7 GB loaded. It was made to catch the planner getting row counts wrong, so it’s a hard test.
- PostgreSQL 16, hypopg 1.4.
- PgLens made 214 planner-validated recommendations for those queries. They name only 10 distinct indexes, because one foreign-key index helps many queries.
- I wrote down the metrics and what counts as a win before the first run: 15% faster is a win, 5% slower is a loss.
What happened
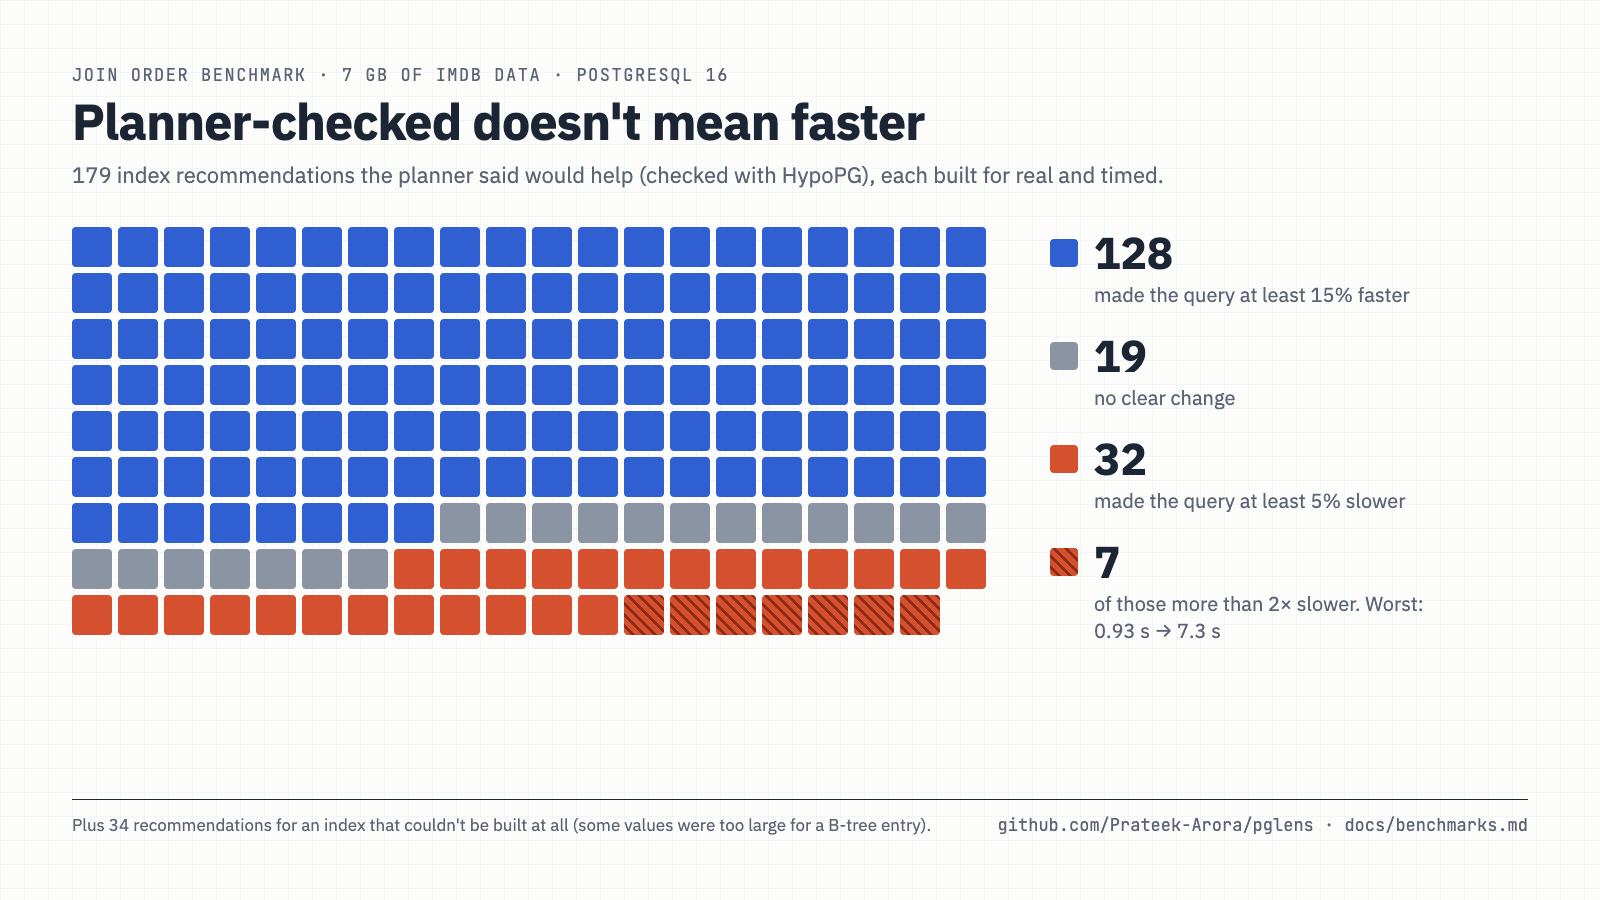
- 128 of 179 made their query at least 15% faster.
- 32 of 179 made it at least 5% slower. 7 made it more than twice as slow.
- 34 couldn’t be measured, because the index can’t be built.
The worst one was query 10c with an index on cast_info (movie_id). Estimated: 91% cheaper.
Measured: 0.93 s before, 7.3 s after. I ran it again by hand to be sure: about 1 s became
about 9 s.
With the index there, the planner picked a nested loop that probes cast_info once per row of a
join. It underestimated how many rows that join returns, so the loop ran far more often than it
planned for: the query read 71 times as many buffers. HypoPG can’t catch this, because it asks the
same planner with the same wrong row counts. Every advisor built on hypothetical indexes
has this blind spot, mine included.
The 34 are one index, PgLens’s #2 suggestion, movie_info (info):
ERROR: index row requires 9392 bytes, maximum size is 8191
1,182 of 14.8 million values are too long for a B-tree entry. A hypothetical index never writes an entry, so it can’t know.
What the planner got right
The ranking. PgLens’s #1 index saved 364 s of the 424 s its queries took, and the order of the indexes by estimated saving was close to the order by measured saving (Spearman 0.83). Per query, the estimated percentage told me almost nothing.
So “which index matters most?” is a fair question for the planner. “How much faster will this query get?” isn’t.
What I changed
- Every planner number in PgLens is labelled as an estimate, and never shown as a speedup.
pglens confirmbuilds the index on a copy of your database and times your own queries with and without it. On the same data it flagged 10c as about ten times slower.- Once you build an index, PgLens shows each query’s measured time before and after.
- It now warns when an index’s column may hold values too long for a B-tree.
Try it
PgLens is open source (Apache-2.0), self-hosted, and only ever reads from your database. It ranks
your queries by the time they actually took, suggests a planner-checked index for each, lets you
time it on a copy first, and shows the measured before and after once you build it. Four make
commands from the README start a demo with a slow workload in about three minutes:
github.com/Prateek-Arora/pglens. It’s a release
candidate, so bug reports are very welcome.
The method, the tables and the scripts are in
docs/benchmarks.md, and
make accuracy-job reruns the whole thing. If you run pglens confirm on a copy of your own
database, I’d like to see the numbers, especially the ones that make my tool look bad.
I built PgLens with Claude Code as a pair. The benchmark design, the rules written down before the run, and every raw number are in the repo, so you don’t have to take my word for any of it.